


The annual State of the API survey is the largest and most comprehensive survey of the API industry. Every year, Postman surveys industry members to get a picture of the API industry—to understand who is working with APIs, how they are getting their work done, and where they see the industry going. More than 13,500 developers, testers, executives, and others took our 2020 survey and provided insights on everything from how they spend their time to what they see as the biggest issues and opportunities for APIs.
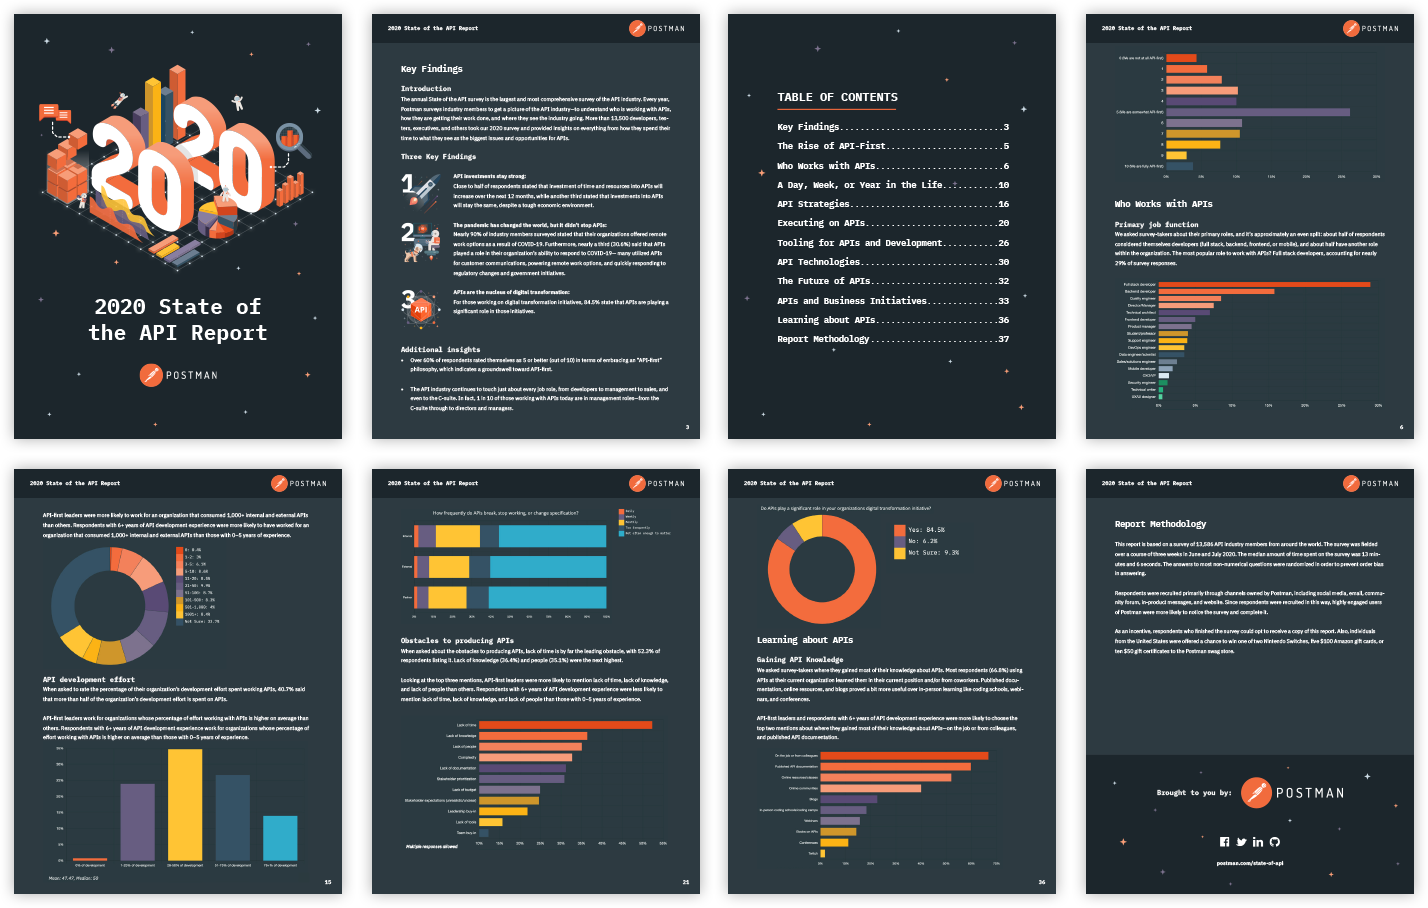
I lead the visual design, identity, UI/UX, illustration, and typography exploration across this entire project. After the survey results were collected they were compiled into a 54-page Google doc. My objective was to take this wall of information and turn it into an easily digestible, responsive, interactive, and visually interesting microsite complimented with downloadable and interactive graphs/charts.
Some outcomes of the report:
120,000 page views and counting! All organic and/or referrals from media outlets / other related websites. No paid ads inflating the numbers.
Shared across 100s of websites and tech blogs. More notably featured at venturebeat.com, nordicapis.com, businesswire.com, techseries.com, zdnet.com, developer-tech.com, startupnewspoint.com, and many more.
The report had quite a long lifespan in terms of references as Venture Beat referenced and shared the report as recently as December 2020 7 months after going live.
Please feel free to take a look at the live site here and poke around.